Custom reporting is one of my all time favorite tools with in the analytics package and I use it for all kinds of different reports.
Since I’m more of an AdWords junkie and I’m a huge believer in ROI and then being able to point to what is and what isn’t working I use this report below.

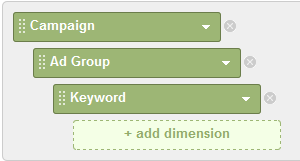
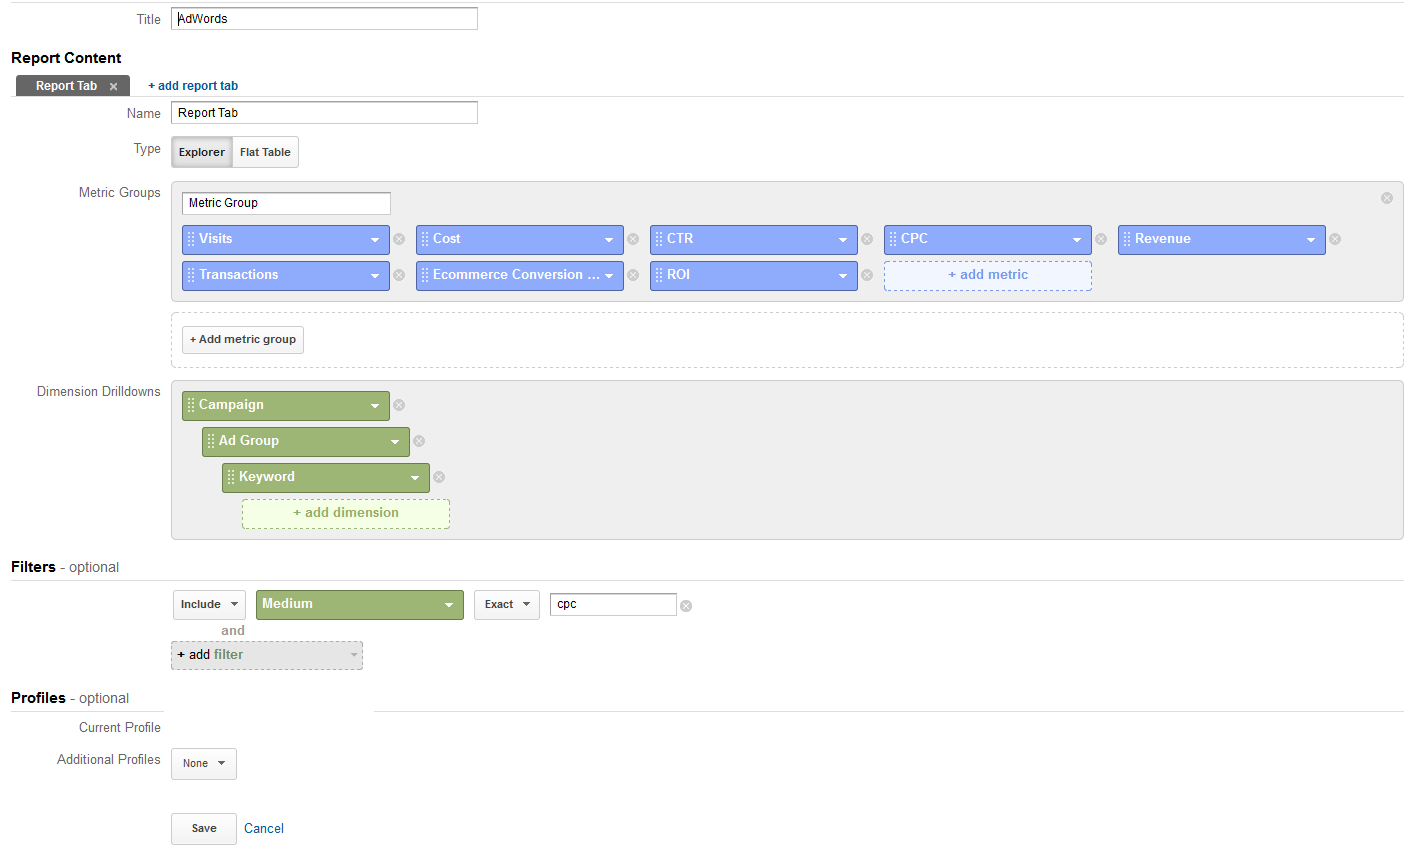
This is how it’s built if you just want to build it by hand. If you’re not wildly familiar with custom reports you might want to use my shared URL and then start learning how they work and tweaking them for your needs.
Shared Link: https://www.google.com/analytics/web/permalink?uid=jyMvWvMJRpmaKddNCnVhyQ
Just copy and paste this into a browser and if you’re signed into analytics it will ask for a profile or populate into your account automatically.
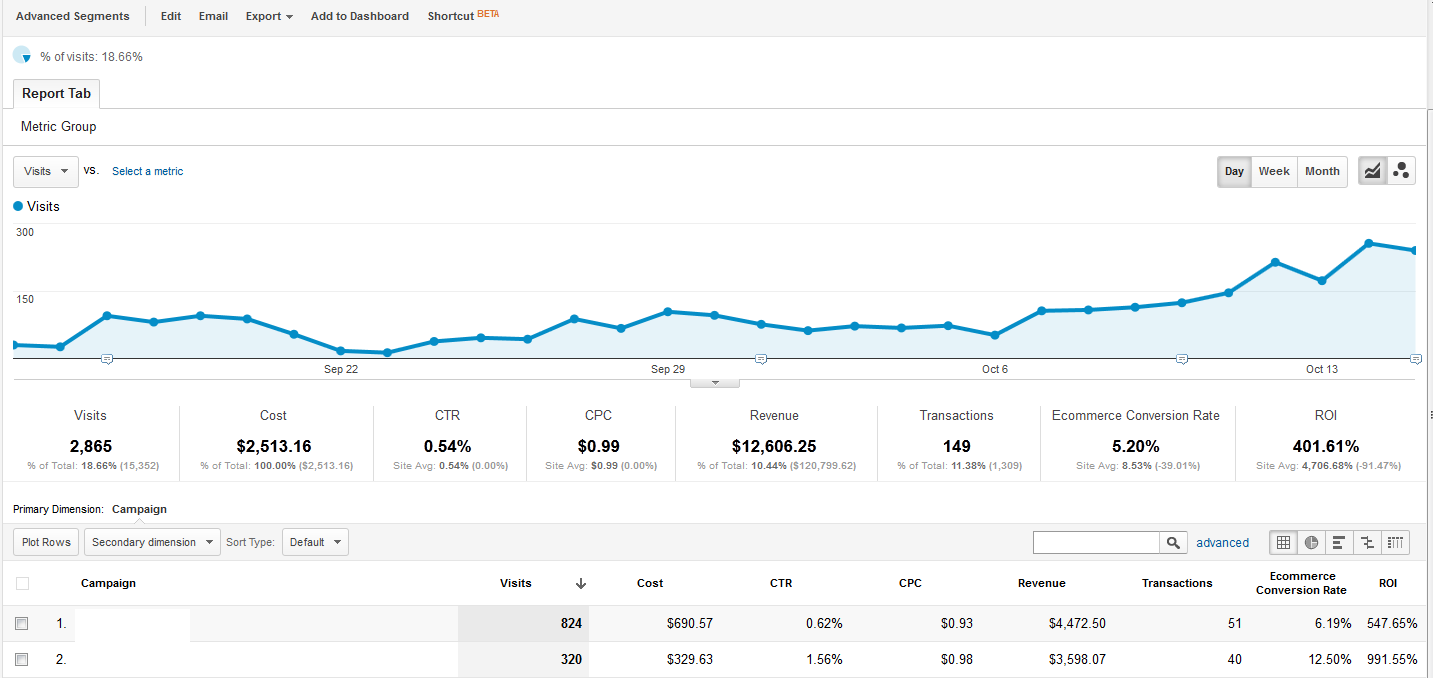
This is what your output will look like if you run it like my example:

All the pertinent information has been deleted to protect the innocent, but you can see from this that you would get all of your basic AdWords data plus an ecommerce conversion rate and ROI.
The graph can be altered to display several different metrics or metrics as they compare to each other.
The other thing I like to do is run the dates to compare to the previous time period and compare so you can show people where it’s been and where you’re going.
Under the campaigns within the list you can click on the campaign and it will show your ad groups and of course when you click on ad groups they will show your keywords with all the same data off to the right.
If you’re not someone who uses custom reports this is a great start, don’t be afraid to save one and tweak it to see different things after all it’s the only way you’ll get comfortable with what data can be found here and how to get it in a moment’s notice.